概率密度估计
非参数方法
Kernel density estimation is a way to estimate the probability density function (PDF) of a random variable in a non-parametric way.
gaussian_kdeworks for both uni-variate and multi-variate data. It includes automatic bandwidth determination. The estimation works best for a unimodal distribution; bimodal or multi-modal distributions tend to be oversmoothed.更多参考wiki.
用gaussian_kde核密度估计这个非参数方法估计概率密度函数,其中bw_method是比较重要的参数,可以是'scott', 'silverman',也可以自己指定数值。kde一些的方法:
- evaluate(Evaluate the estimated pdf on a set of points),
- integrate_box_1d(Computes the integral of a 1D pdf between two bounds.),
- integrate_box(Computes the integral of a pdf over a rectangular interval.),
- resample(Randomly sample a dataset from the estimated pdf)
- pdf(Evaluate the estimated pdf on a provided set of points. This is an alias for
gaussian_kde.evaluate)
本地查看源代码subl /usr/local/lib/python2.7/site-packages/scipy/stats/kde.py,里面的注释堪比文档。
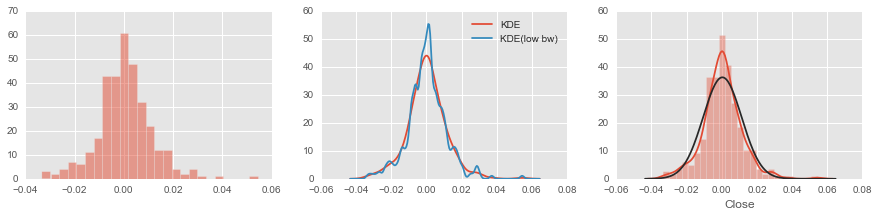
# 核密度估计
kde = stats.kde.gaussian_kde(rs)
kde_low_bw = stats.kde.gaussian_kde(rs, bw_method=0.10)
x = np.linspace(rs.min()-0.01,rs.max()+0.01,200)
fig, axes = plt.subplots(1, 3, figsize=(15, 3))
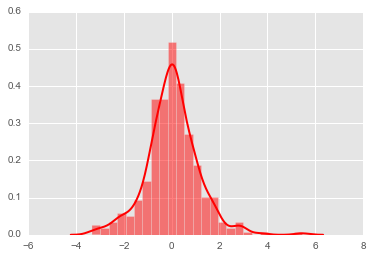
axes[0].hist(rs,alpha=0.5,bins=25)
axes[1].plot(x,kde(x),label='KDE')
axes[1].plot(x,kde_low_bw(x),label='KDE(low bw)')
axes[1].legend()
# 对比histoplot,kde以及norm
sns.distplot(rs, fit=stats.norm, bins=25, ax=axes[2])
plt.show()
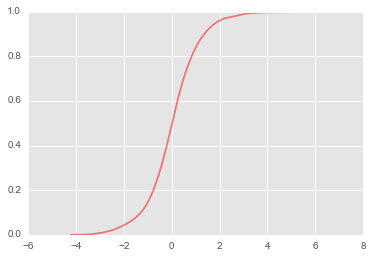
实现cdf
kde没有提供cdf函数,可以用积分实现(kde.integrate_box_1d)
def _kde_cdf(x):
    return kde.integrate_box_1d(-np.inf, x)
kde_cdf = np.vectorize(_kde_cdf)
fig, ax = plt.subplots(1, 1, figsize=(8, 3))
x = np.linspace(rs.min(), rs.max(),100)
ax.plot(x, kde_cdf(x))
fig.tight_layout()
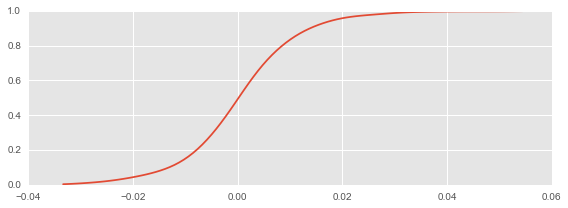
收益率小于零的概率
print kde_cdf(0)
0.491732531695
机器学习
sklearn模块也提供相应的核密度估计功能,比如neighbors的KernelDensity函数,比如sklearn.mixture的Gaussian mixture models提供的核密度估计功能。
3.4.1 Sklearn.neighbors.KernelDensity
文档参考。
# 收益率用百分比表示
# reshape data and norm it
xrs = 100*rs.reshape((-1,1))
from sklearn.neighbors import KernelDensity

x = np.linspace(-5,5,1000)
xpdf = x.reshape((-1,1))
kde = KernelDensity(bandwidth=0.25,kernel='gaussian').fit(xrs)
density_kde = np.exp(kde.score_samples(xpdf))

plt.hist(xrs, bins=25,normed=True, alpha=0.5)
plt.plot(xpdf, density_kde, '-r', label='KDE')
plt.legend();
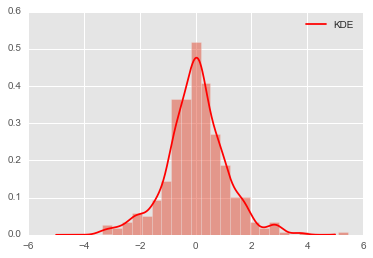
计算收益率小于0的概率
用numpy提供的梯形积分法np.trapz数值积分,得到收益率小于0的概率,相当于cdf(0).
# 接近0.5
np.trapz(density_kde[:500],x[:500])
0.48866206617866448
Gaussian Mixture Models
利用期望最大算法EM,文档参考.
Representation of a Gaussian mixture model probability distribution. This class allows for easy evaluation of, sampling from, and maximum-likelihood estimation of the parameters of a GMM distribution.
from sklearn.mixture import GMM
x = np.linspace(-5,5,1000)
xpdf = x.reshape((-1,1))
# GMM.fit() Estimate model parameters with the EM algorithm.
clf = GMM(4,n_iter=500,random_state=3).fit(xrs) # fit return series
density_gmm = np.exp(clf.score(xpdf))

plt.hist(xrs,bins=25,normed=True,alpha=0.5)
plt.plot(xpdf, density_gmm, '-r', label='GMM')
plt.legend();
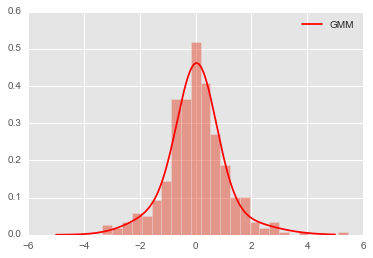
计算收益率小于0的概率
同样用numpy提供的梯形积分法np.trapz数值积分,得到收益率小于0的概率,相当于cdf(0).
# 接近0.5
np.trapz(density_gmm[:500],x[:500])
0.48597555545317966
StatsModel
用statsmodel的sm.nonparametric.KDEUnivariate提供的Univariate Kernel Density Estimator来实现。文档参考.
import statsmodels.api as sm
kde_stats = sm.nonparametric.KDEUnivariate(xrs)
kde_stats.fit()
plt.hist(xrs, bins=25, normed=True, color='red',alpha=0.5)
plt.plot(kde_stats.support, kde_stats.density, lw=2, color='red');
plt.plot(kde_stats.support,kde_stats.cdf,color='red',alpha=0.5);
计算收益率小于0的概率
kde_stats.cdf返回的是一个np.ndarray,不是连续的函数,无法直接cdf(0)这样求小于0的概率,需要手动计算一下。利用kde_stats.support返回的数组。
value = 0
idx = (np.abs(kde_stats.support-value)).argmin() # 找离value最近的
kde_stats.cdf[idx] # 接近0.5
0.48813598179534551