收益率比较
使用Pandas中的函数,下载你感兴趣的任意两支股票的数据,计算日收益率序列,使用假设检验来判断这两支股票的平均收益率是否有差别。
选取中石油(601857.ss)和中石化(600028.ss),从yahoo金融获取数据。
如果你不了解假设检验,这篇大白话科普文章可能有帮助,戳这,以及这篇demo scipy模块的文章。
start1 = datetime.datetime(2015, 1, 1)
end1 = datetime.datetime(2016,1,1)
zsy = data.DataReader("601857.SS", 'yahoo', start1, end1)
zsh = data.DataReader("600028.SS", 'yahoo', start1, end1)
zsy_rs = get_rs(zsy['Close'])
zsh_rs = get_rs(zsh['Close'])
zsy_rs.max(),zsh_rs.max()
(0.10524368640364806, 0.1058068446096677)
zsy_rs.min(),zsh_rs.min()
(-0.095384147036874575, -0.095543851963350482)
# 可视化对比两股数据
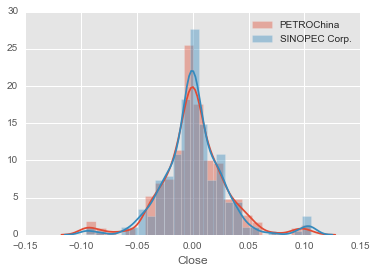
sns.distplot(zsy_rs,label='PETROChina')
sns.distplot(zsh_rs,label='SINOPEC Corp.')
plt.legend()
plt.show()

平均收益率
直观上看,中石油和中石化在15到16年的收益数据差别很不明显。下面用ttest_ind函数从统计上看是不是有差别。
stats.ttest_ind: Calculates the T-test for the means of TWO INDEPENDENT samples of scores. We can use this test, if we observe two independent samples from the same or different population, e.g. exam scores of boys and girls or of two ethnic groups. The test measures whether the average (expected) value differs significantly across samples. If we observe a large p-value, for example larger than 0.05 or 0.1, then we cannot reject the null hypothesis of identical average scores. If the p-value is smaller than the threshold, e.g. 1%, 5% or 10%, then we reject the null hypothesis of equal averages.
例子
rvs1 = stats.norm.rvs(loc=5,scale=10,size=500)
rvs2 = stats.norm.rvs(loc=5,scale=10,size=500)
stats.ttest_ind(rvs1,rvs2)
# Out[0] (0.26833823296239279, 0.78849443369564776)
stats.ttest_ind(zsy_rs, zsh_rs,equal_var=False)
Ttest_indResult(statistic=-0.01611038673003291, pvalue=0.98715252169245016)
从检验结果看,P值很高,我们有信心说在这段时间内,中石油和中石化的平均收益率没有显著性差异。
尝试手动实现这一检验,理论公式参考维基百科,同时扒一些python的源码,实现equal or unequal sample size 以及 equal var or unequal var的检验。对比直接调用函数的结果,完全符合。
from collections import namedtuple
Ttest_indResult = namedtuple('Ttest_indResult', ('statistic', 'pvalue'))

def my_ttest_ind(a,b,equal_var=False):
    # only for 1d case
    a, b = np.asarray(a), np.asarray(b)
    v1, v2 = np.var(a,ddof=1),np.var(b, ddof=1)
    n1, n2 = a.shape[0], b.shape[0]

    def _equal_var_ttest_denom(v1,n1,v2,n2):
        df = n1 + n2 - 2
        svar = ((n1 - 1) * v1 + (n2 - 1) * v2) / float(df)
        denom = np.sqrt(svar * (1.0 / n1 + 1.0 / n2))
        return df, denom

    def _unequal_var_ttest_denom(v1,n1,v2,n2):
        vn1, vn2 = v1 / n1, v2 / n2
        df = (vn1 + vn2)**2 / (vn1**2 / (n1 - 1) + vn2**2 / (n2 - 1))
        denom = np.sqrt(vn1 + vn2)
        return df, denom

    def _ttest_ind_from_stats(mean1, mean2, denom, df):

        d = mean1 - mean2
        t = np.divide(d, denom)
        # use np.abs to get upper tail
        prob = stats.t.sf(np.abs(t), df) * 2
        return (t, prob)

    if equal_var:
        df, denom = _equal_var_ttest_denom(v1, n1, v2, n2)
    else:
        df, denom = _unequal_var_ttest_denom(v1, n1, v2, n2)

    res = _ttest_ind_from_stats(np.mean(a), np.mean(b), denom, df)
    return Ttest_indResult(*res)

my_ttest_ind(zsy_rs,zsh_rs)
Ttest_indResult(statistic=-0.01611038673003291, pvalue=0.98715252169245016)