from mpl_toolkits.basemap import Basemap
import matplotlib.pyplot as plt
import numpy as np
%matplotlib inline
/usr/local/lib/python2.7/site-packages/matplotlib/font_manager.py:273: UserWarning: Matplotlib is building the font cache using fc-list. This may take a moment.
  warnings.warn('Matplotlib is building the font cache using fc-list. This may take a moment.')
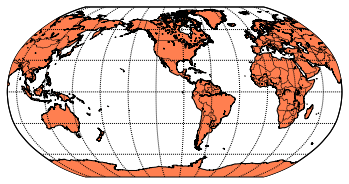
my_map = Basemap(projection='robin', lat_0=0, lon_0=-100,
              resolution='l', area_thresh=1000.0)

my_map.drawcoastlines()
my_map.drawcountries()
my_map.fillcontinents(color='coral')
my_map.drawmapboundary()

my_map.drawmeridians(np.arange(0, 360, 30))
my_map.drawparallels(np.arange(-90, 90, 30))

plt.show()
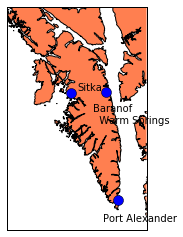
One way to zoom in is to specify the latitude and longitude of the lower left and upper right corners of the region you want to show. Let’s use a mercator projection, which supports this method of zooming. The notation for “lower left corner at 136.25 degrees west and 56 degrees north” is: llcrnrlon = -136.25, llcrnrlat = 56.0
Note that the center of the map, given by lat_0 and lon_0, must be within the region you are zoomed in on.
This is now a meaningful map. We can see Kruzof island, the large island to the west of Baranof, and many other islands in the area. Settings lower than area_thresh=0.1 won't add any new details at this level of zoom.
my_map = Basemap(projection='merc', lat_0=57, lon_0=-135,
    resolution = 'h', area_thresh = 0.1,
    llcrnrlon=-136.25, llcrnrlat=56,
    urcrnrlon=-134.25, urcrnrlat=57.75)

my_map.drawcoastlines()
my_map.drawcountries()
my_map.fillcontinents(color='coral')
my_map.drawmapboundary()

my_map.drawmeridians(np.arange(0, 360, 30))
my_map.drawparallels(np.arange(-90, 90, 30))

# plot point
lon = -135.3318
lons = [-135.3318, -134.8331, -134.6572]
lats = [57.0799, 57.0894, 56.2399]
x,y = my_map(lons, lats)
my_map.plot(x, y, 'bo', markersize=10)

labels = ['Sitka', 'Baranof\n  Warm Springs', 'Port Alexander']
x_offsets = [10000, -20000, -25000]
y_offsets = [5000, -50000, -35000]

for label, xpt, ypt, x_offset, y_offset in zip(labels, x, y, x_offsets, y_offsets):
    plt.text(xpt+x_offset, ypt+y_offset, label)

plt.show()